Single-nucleus transcriptomics · Parkinson’s disease
GPNMB in Parkinson’s disease: single-nucleus RNA-seq re-analysis
A focused re-analysis of human substantia nigra pars compacta single-nucleus RNA-seq to find where GPNMB is expressed, whether its microglial expression differs between Parkinson’s disease and controls, and whether independent published analyses point the same way. It adds cell-type context to the genetic evidence from my dissertation.
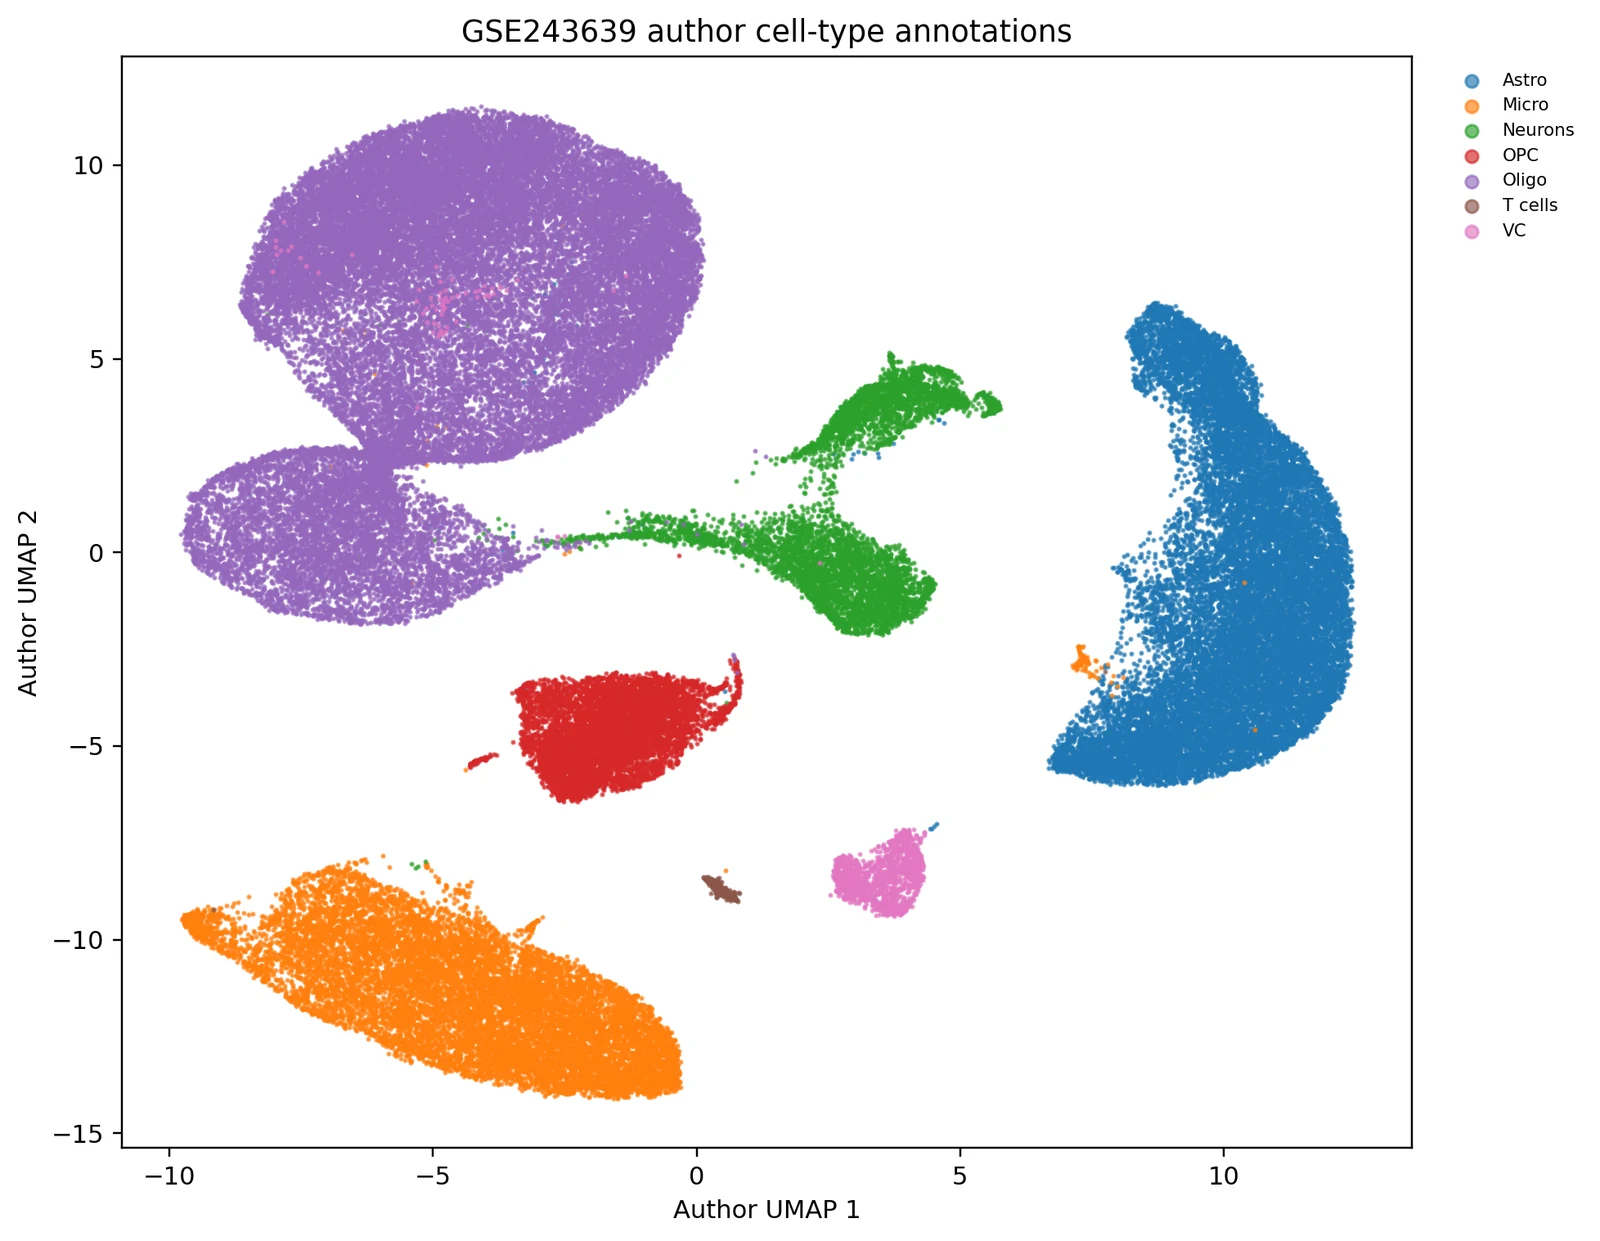
Where is GPNMB expressed, and does it change in PD?
Genetic evidence can prioritise a protein, but it doesn’t say which cells matter. I asked in which substantia nigra cell populations GPNMB is expressed, and how its expression and the associated microglial programme differ between Parkinson’s disease and controls. GPNMB was a pre-specified target, not a hit picked from transcriptome-wide results.
Donors, not nuclei, are the replicates
Cell-level differential expression can overstate evidence when thousands of nuclei from the same donor are treated as independent. The analysis rules were fixed before looking at disease effects and stored in config.yaml so changes stay auditable.
- Formal PD–control tests use donor-level pseudobulk counts from raw integers; cell-level plots are descriptive only.
- At least 30 nuclei per donor and at least 5 eligible donors per condition before testing.
- Primary design
~ age + sex + condition, deliberately not overfitting a 29-donor cohort. - Harmony off by default: it can help embeddings but can also erase real donor biology, and never feeds DE counts.
- External validation kept separate from discovery.
Highest in microglia, with OPCs close behind
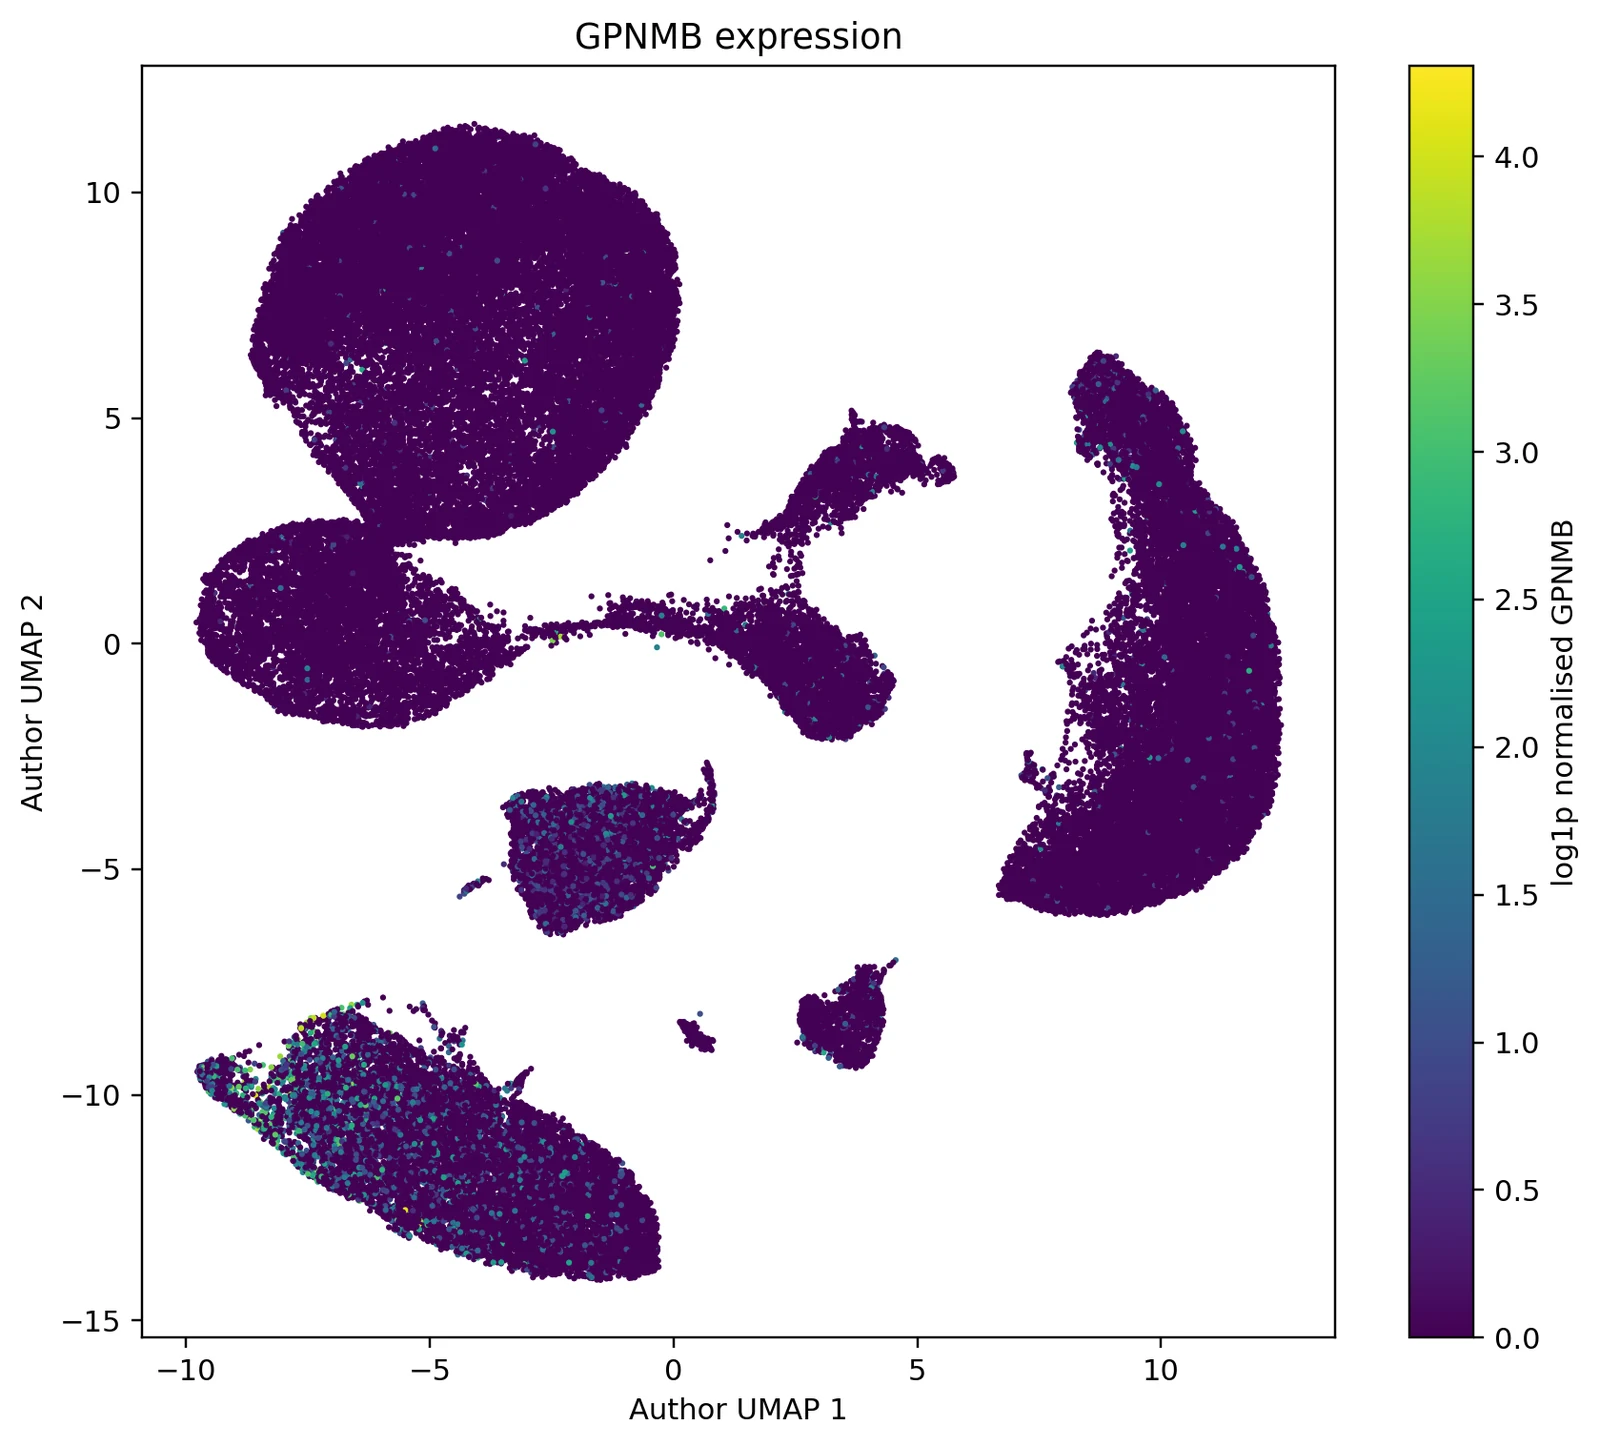
| Cell type | Donors | Median donor expression | Detection fraction | Nuclei |
|---|---|---|---|---|
| Microglia | 29 | 0.2890 | 0.1844 | 12,995 |
| OPC | 29 | 0.1732 | 0.1717 | 6,644 |
| Vascular | 29 | 0.0801 | 0.0620 | 1,560 |
| Astrocytes | 29 | 0.0233 | 0.0169 | 20,710 |
| Neurons | 29 | 0.0213 | 0.0269 | 6,196 |
| Oligodendrocytes | 29 | 0.0082 | 0.0075 | 35,032 |
| T cells | 26 | 0.0000 | 0.0000 | 347 |
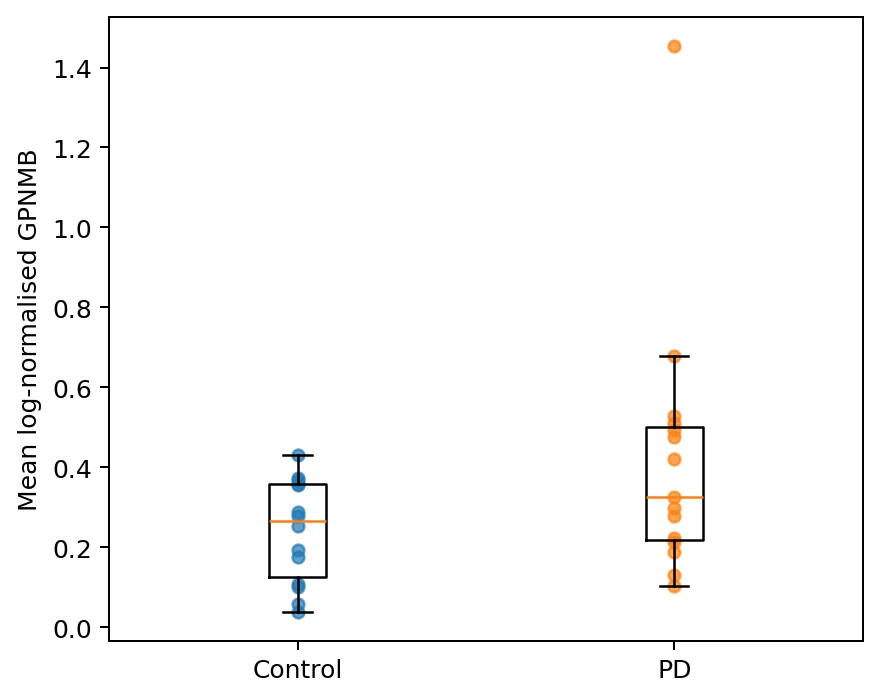
About two-fold higher in PD microglia, nominally
Donor-level pseudobulk on 14 control and 15 PD donors, adjusted for age and sex, gave log2FC +1.025 (SE 0.390; P = 0.00863), roughly 2.03-fold higher GPNMB in PD microglia. It does not survive transcriptome-wide FDR (0.218).
Broad microglial abundance was not detectably different between groups (propeller P = 0.587), so the higher signal isn’t simply more microglia in PD donors. Neuronal proportion was lower in PD (P = 0.009) but did not cross FDR < 0.05 (0.062).
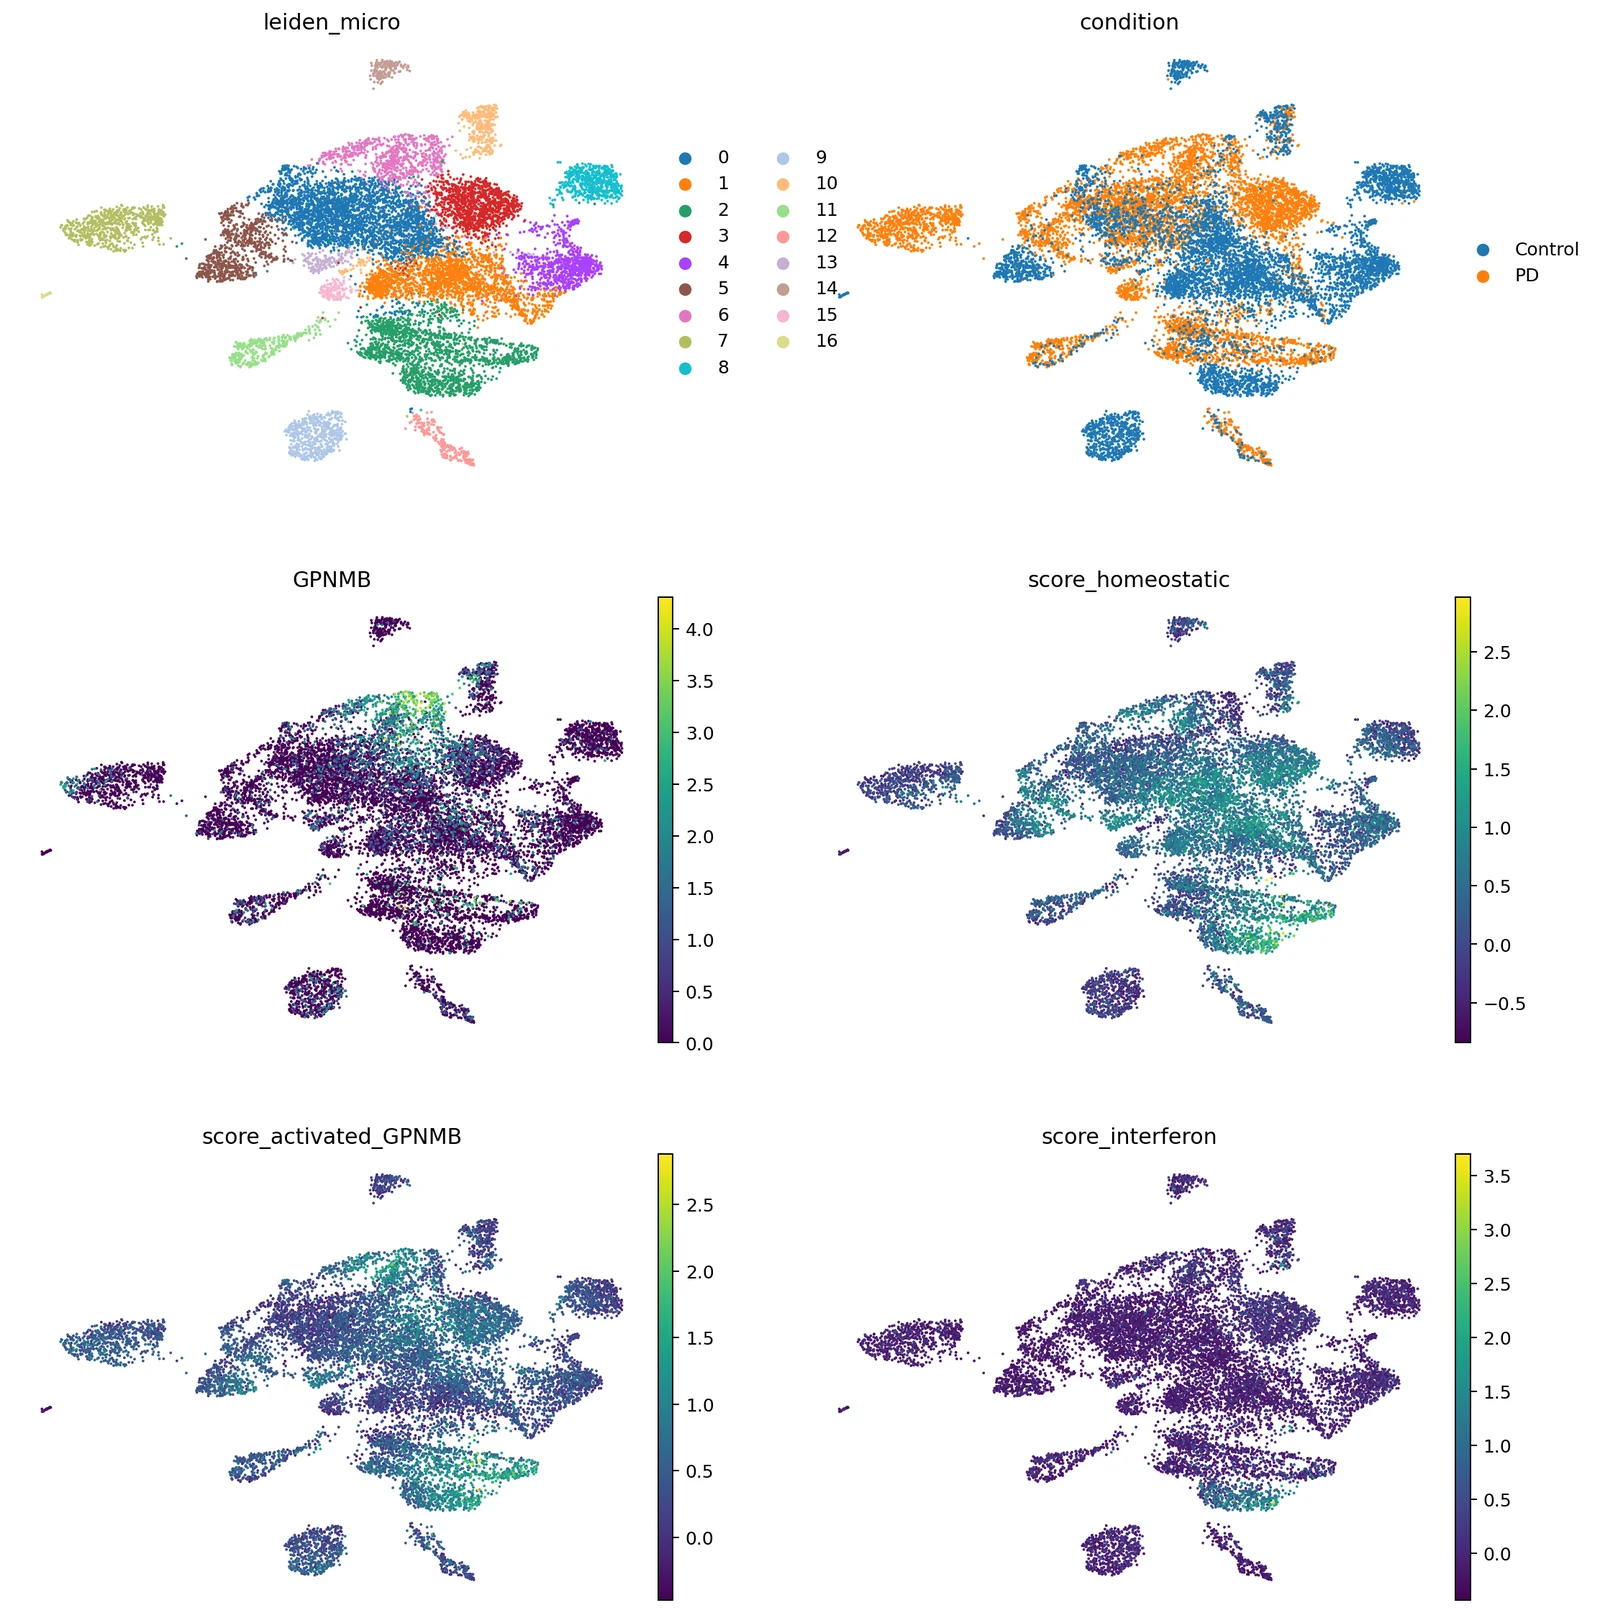
Underpowered for transcriptome-wide significance, not evidence against an effect
A nominal P with FDR 0.218 can mean a small effect or a small cohort. To tell them apart I simulated donor-level GPNMB pseudobulk counts from a negative binomial calibrated to this result: the dispersion was back-solved so the real ~ age + sex + condition design reproduces the observed standard error (0.390), and age and sex were resampled from the real donors. Each simulated cohort was re-tested with a Wald test, 5,000 times per scenario. Under no effect the false-positive rate stayed between 4.8% and 6.1%.
Two bars matter. As the pre-specified target, GPNMB only needs P < 0.05. To survive transcriptome-wide correction it needed P ≤ 4.9 × 10⁻⁴, the Benjamini–Hochberg cut-off this analysis actually used (141 of 14,358 genes at FDR 0.05).
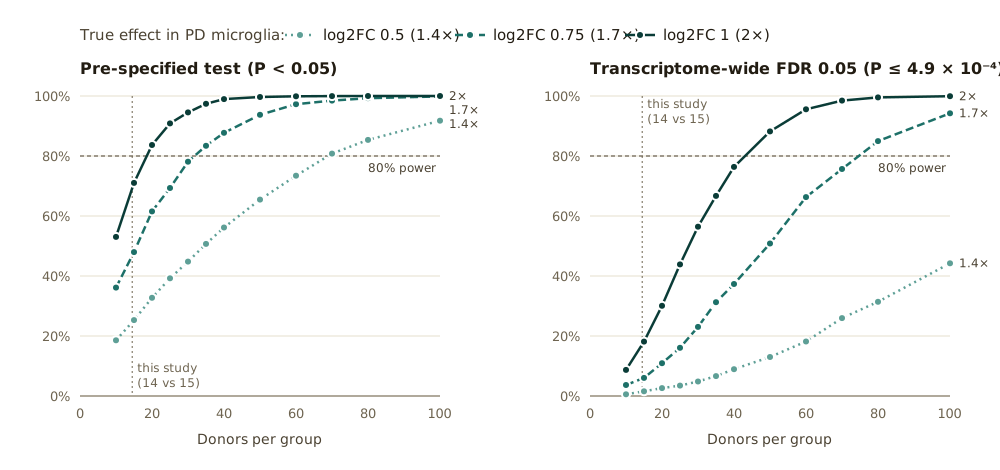
| True effect | Power now, P < 0.05 | Power now, FDR | Donors/group for 80%, P < 0.05 | Donors/group for 80%, FDR |
|---|---|---|---|---|
| 1.4× (log2FC 0.5) | 25% | 2% | 70 | >100 |
| 1.7× (log2FC 0.75) | 48% | 6% | 35 | 80 |
| 2.0× (log2FC 1.0, as observed) | 71% | 18% | 20 | 50 |
Even if the observed two-fold effect is real, a 29-donor cohort had about an 18% chance of clearing transcriptome-wide FDR, so the non-significant FDR is what this design would usually produce. Confirming it at FDR would take roughly 50 donors per group. This bar is conservative, because a larger cohort would reject more genes and loosen the cut-off. The dispersion is held at its calibrated value rather than re-estimated in each simulation, which makes the estimates slightly optimistic.
Same direction, variable strength
| Dataset | Method | log2FC | P | FDR |
|---|---|---|---|---|
| GSE243639 (this analysis) | Donor-level pseudobulk DESeq2 | +1.025 | 0.00863 | 0.218 |
| GSE184950 / Wang | Donor-aware microglial MAST | +0.113 | 0.131 | 1.000 |
| Wang + Kamath + Smajic | Multi-dataset microglial pseudobulk | +0.933 | 0.00186 | 0.0501 |
GSE184950 is used through its published supplementary tables, because the public Seurat object lacks the final cell-type labels needed for a defensible microglial pseudobulk.
What it supports
- GPNMB expression concentrated in microglia.
- A positive, nominally significant PD effect in donor-level pseudobulk.
- Directional consistency across independent studies.
- That the missed FDR is expected at 29 donors (≈18% power for a two-fold effect).
What it doesn’t show
- That GPNMB causes PD, or whether higher GPNMB is harmful or protective.
- A significant replication in GSE184950 alone.
- That a specific microglial state mediates the genetic association.